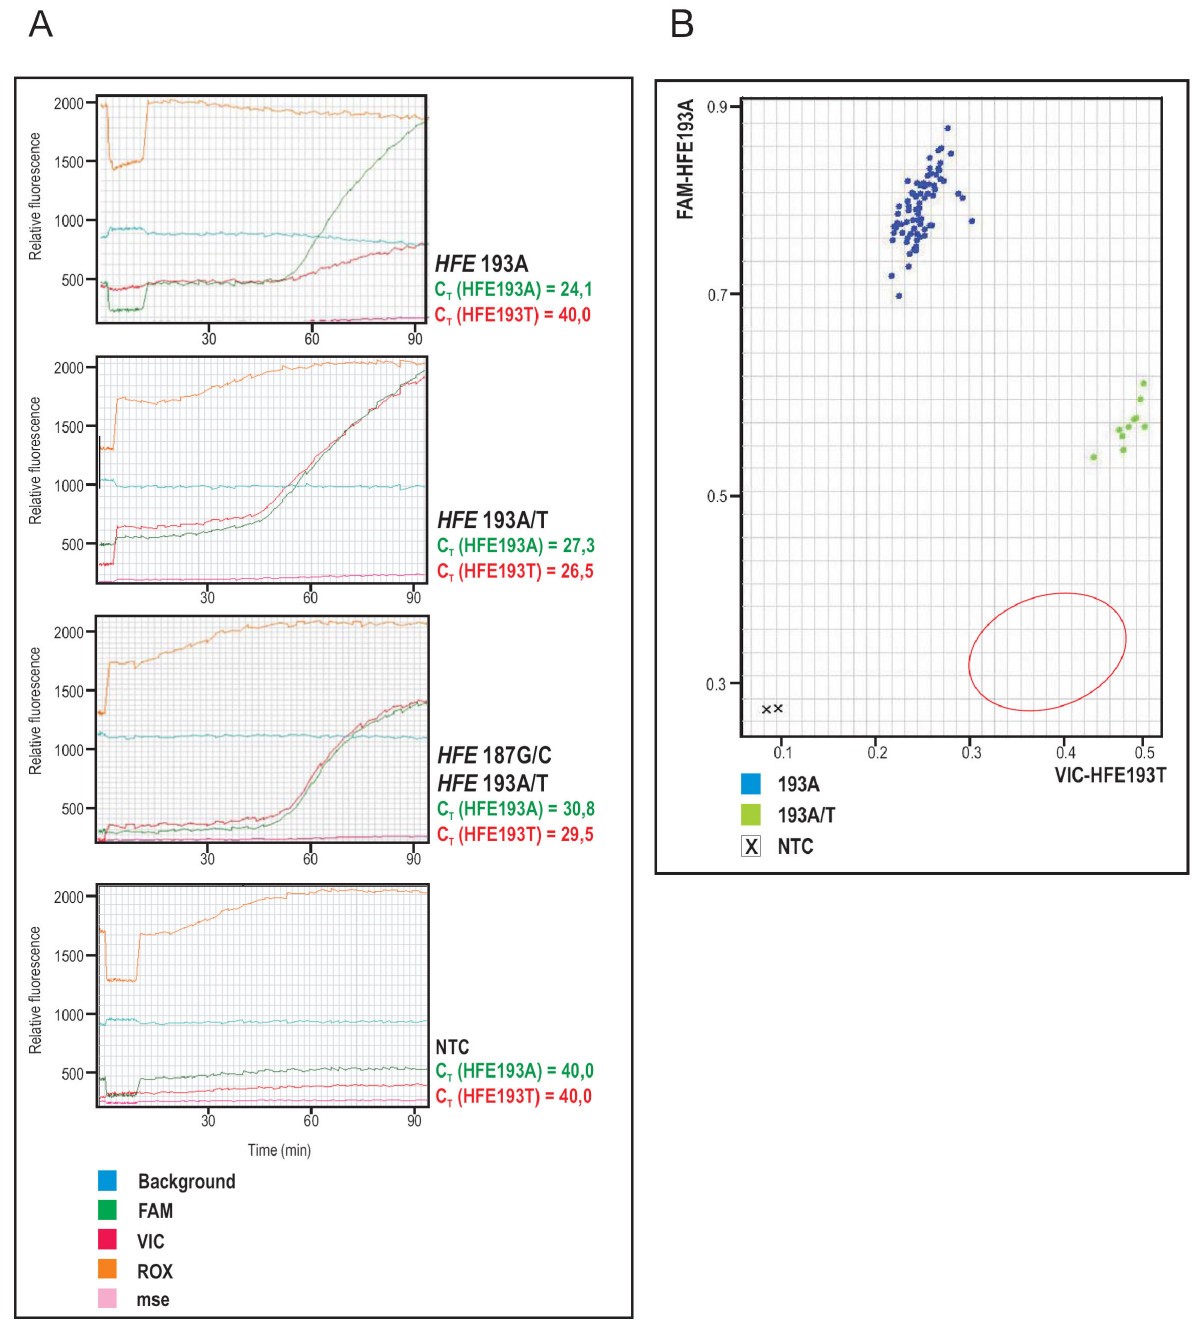
Figure 1

Validation of the real-time PCR assay for the 193A→T (S65C) mutation detection. (A) A multicomponent real-time amplification plots created by the SDS software. The genotypes are indicated with bold. The CT values of individual probes for all genotypes are presented. Curves in the plots correspond to the indicated fluorophores or water (see the legend); ROX, internal reference dye; mse, mean squared error; NTC, no-template control. (B) End-point fluorescence detection is shown by the scattered diagram. Clustering of genotypes is based on the relative fluorescence from each well on 96-well plate. The expected area for 193 mutant homozygote samples clustering is indicated by red circle.